-
Share Graph
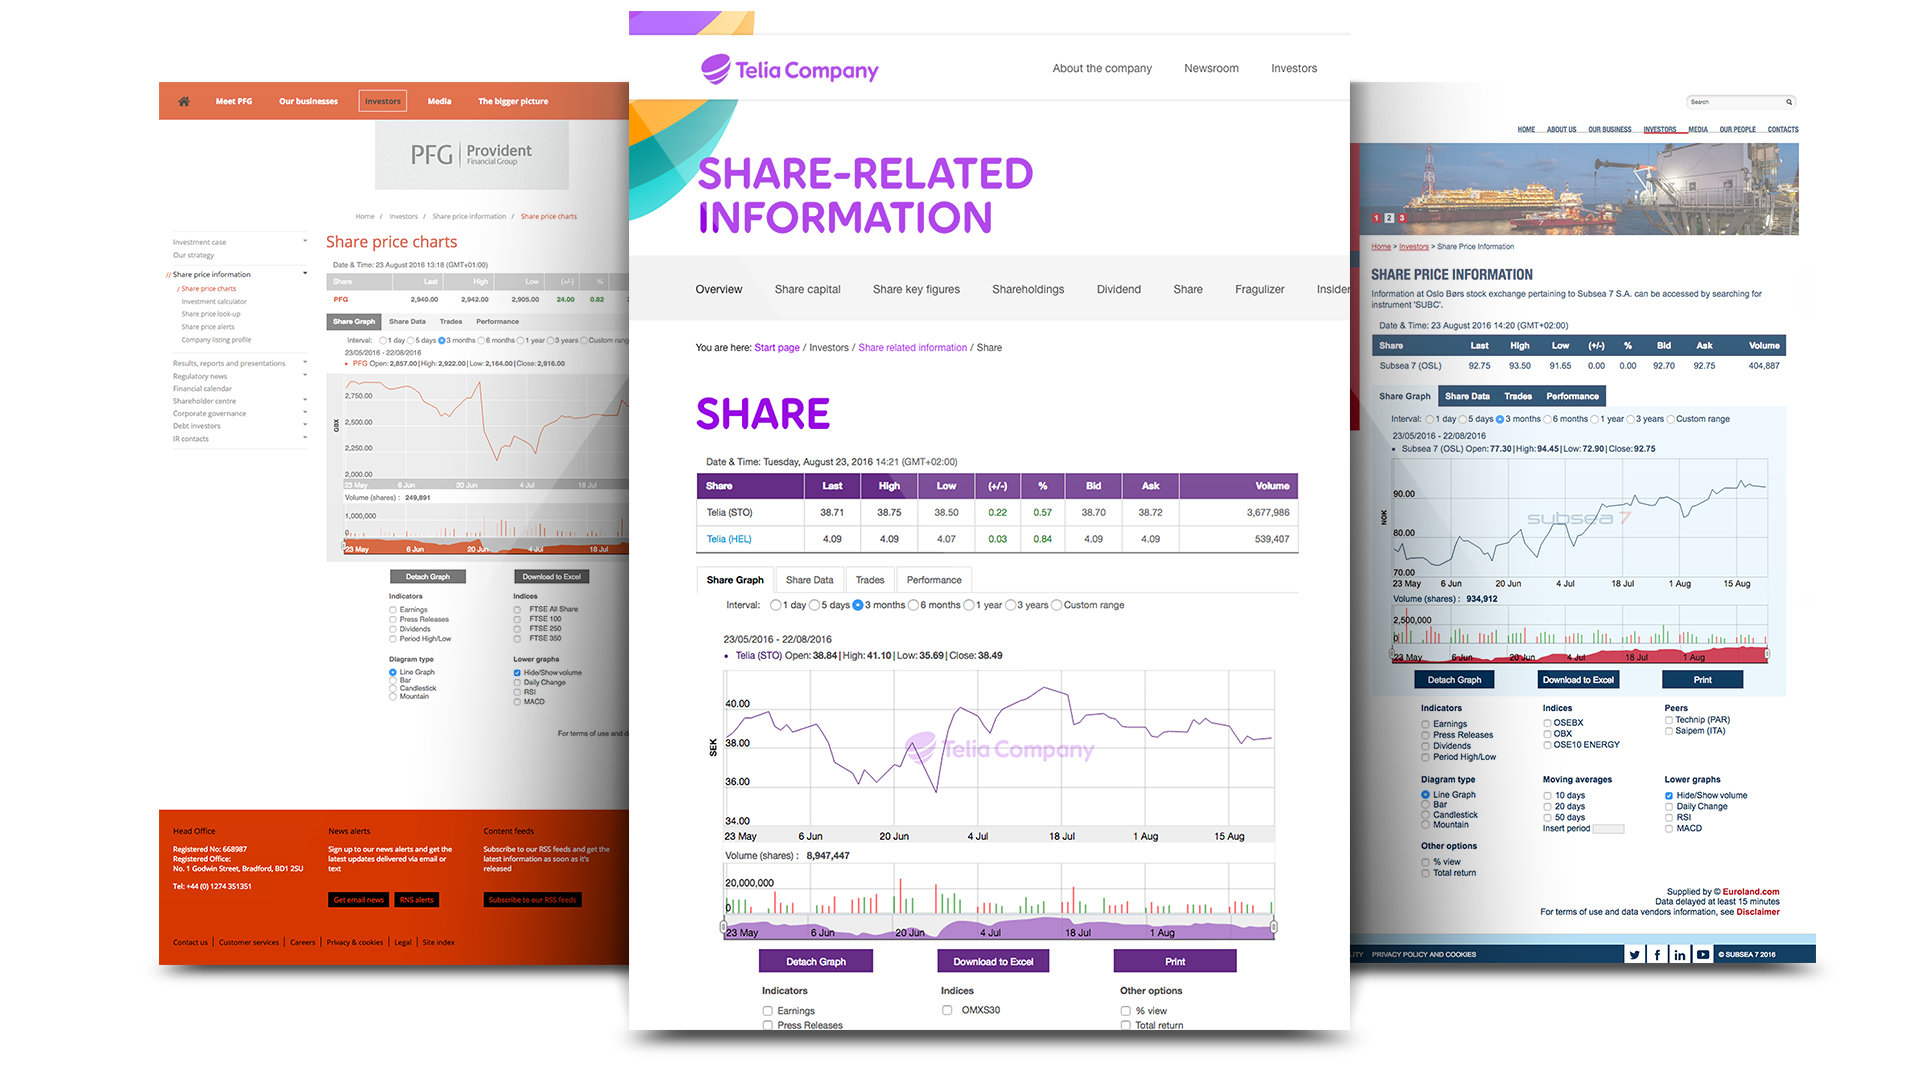
Our share graph allows you to present your share performance in the most comprehensive and compelling way possible. We showcase your share in the best light.
-

Features
With our share graph, your share price is presented to provide full context to your Equity story.
-
Analytical
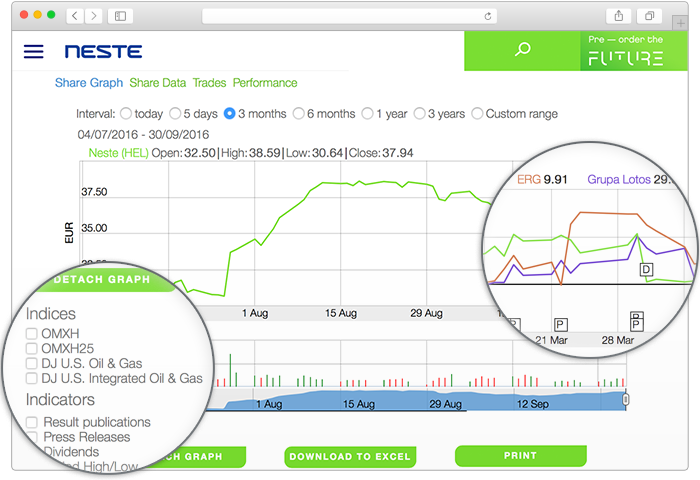
We make sure not to just present your current share price, but the context behind it. Get the full story by analysing the share's reaction to Earnings, Indices, Peers and more.
-
Responsive
Our share graph, like all our tools, is responsive and blends in seamlessly with your website layout. The options for customisation are limitless and our tools always utilizes the latest technology.
-
Consolidated
All important information concerning your share price is consolidated within one tool, producing a transparent and enlightening overview of your Equity story.
-
Downloadable
Your data is downloadable in a variety of formats, enabling your investors to undertake their own analysis, as well as allowing you to create presentation material seamlessly.
-

-
Your share price - Explained
To help build an understanding of your share price, the most important aspect you can give investors is context. We enable your present and future stakeholders to gain as complete an insight into the movement of your share price as possible. We ensure that your share price performance is comparable with indicies, peers and indicators such as press releases and result publications.
-
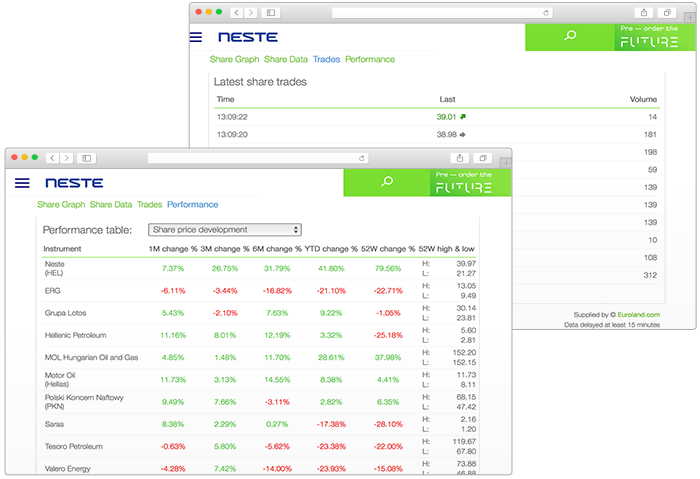
We focus and consolidate your share information by also including basic share data, latest trades by broker, order depth and long-term performance. By putting your share price against a background of contextual information, your investors get a broader and fuller understanding of your performance. A deeper understanding is the foundation of a better, longer relationship with your investors.
-

